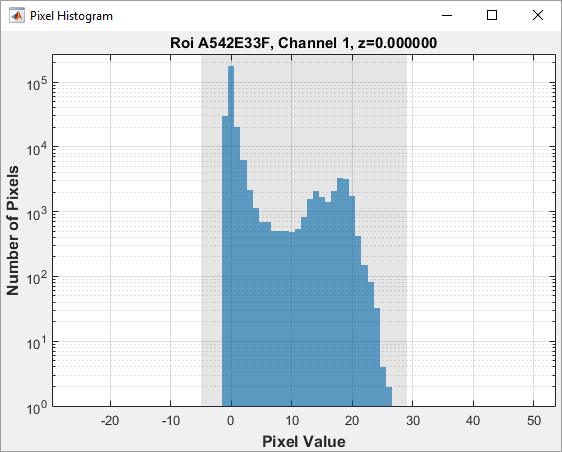
The live channel histogram of the currently displayed image can be viewed by right clicking the image in the channel display window and selecting 'Histogram'.
The live histogram shows the pixel density for different pixel values on a logarithmic scale. The maximum/minimum range of the digitizer is marked in red. The histogram can be navigated using the mouse wheel and by dragging the histogram to the left and right. The gray shaded area shows the look up table for the channel display. By dragging the shaded area, the look up table can be directly adjusted in the histogram.
Live Histogram
Error rendering macro 'html' : Notify your Confluence administrator that "Bob Swift Atlassian Add-ons - HTML" requires a valid license. Reason: VERSION_MISMATCH
The Live Histogram can be navigated using the mouse. Manipulating the gray shaded area adjusts the channel look up table.