Integration Control Window | ROI Integrator Traces Window |
|---|---|
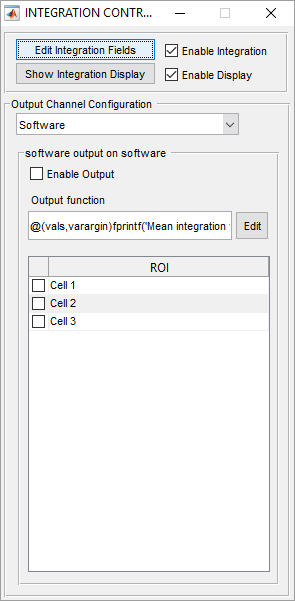 |  |
Integration Control Window
| Enable Integration | Enables the online ROI Integration feature. When enabled, the Roi Integration Display shows live traces of the configured ROIs and the integration output channels are updated. If in a Grab or Loop and saving is enabled, a CSV file is written to disk, which contains the integration value for each selected ROI.
|
| Enable Display | Enables / disables updating the live traces display. |
| Edit Integration Fields | Opens the ROI/Stimulus Group Editor. This allows to define the ROIs for online analysis. |
| Show Integration Display | Opens the ROI Integrator Traces Window |
Output Channel Configuration - Channel | Select which output channel to configure |
| Enable Output | Enables the currently selected output channel |
| Output Function Edit | Edits the function handle used to generate the channel output. |
| ROIs | Select which ROIs are passed to the output function for processing. |
ROI Integrator Traces Window
| Reset Data | Resets the data in the display. |
| History Length | Determines how many time data points are shown in the display. |
| CLim/YLim | Defines the color lookup table limits of the heatmap display and the y-limits of the traces display. Set to 'Auto' for autoscaling or enter the minimum/maximum value in form of a 2 element vector (e.g. [0, 1000] ) |
| Display Rate | Limits the refresh rate of the display (Unit: Hz). Default value: Inf |
Show Heatmap | Shows/Hides the Heatmap display |
| Show Traces | Shows/Hides the Traces display |
The Heatmap can be navigated with the mouse:
| Control | Action |
|---|---|
| Move mouse over row in heatmap display | Show the trace of the selected ROI in the traces view. Highlight the ROI shape in the channels display window. |
| Drag a row in the heatmap display | Reorder the rows in the heatmap display |
| Double click on a row in the heatmap display | Select/Unselect the ROI for display in the traces view. |